Australian Climate Influences & Gliding Conditions

"Oh no, not another La Niña, this will be terrible for gliding!"

I'm sure all glider pilots in Australia have either said or heard this. But what is actually behind this statement? Do La Niña and El Niño really significantly affect gliding weather? If yes, does it make a difference whether you're up in Queensland or down in South Australia? And what other weather systems influence gliding conditions? In this blog post, I aim to address these questions and perform statistical analysis to answer which weather influences impact gliding conditions across Australia. This work is a collaboration with SkySight.

Too lazy to read the entire blog post and just want an answer? Go straight to the summary table.

Some basic climatology

Let's start with a little bit of background on climatology. the weather is incredibly important for glider pilots, as we rely on rising air to stay airborne. Thankfully, we don't need to understand the details of how weather systems influence gliding conditions, as we have SkySight that tells us whether the conditions are suitable for long flights or not. In this blogpost, we want to examine some of the climate influences and how they affect gliding conditions over longer periods.

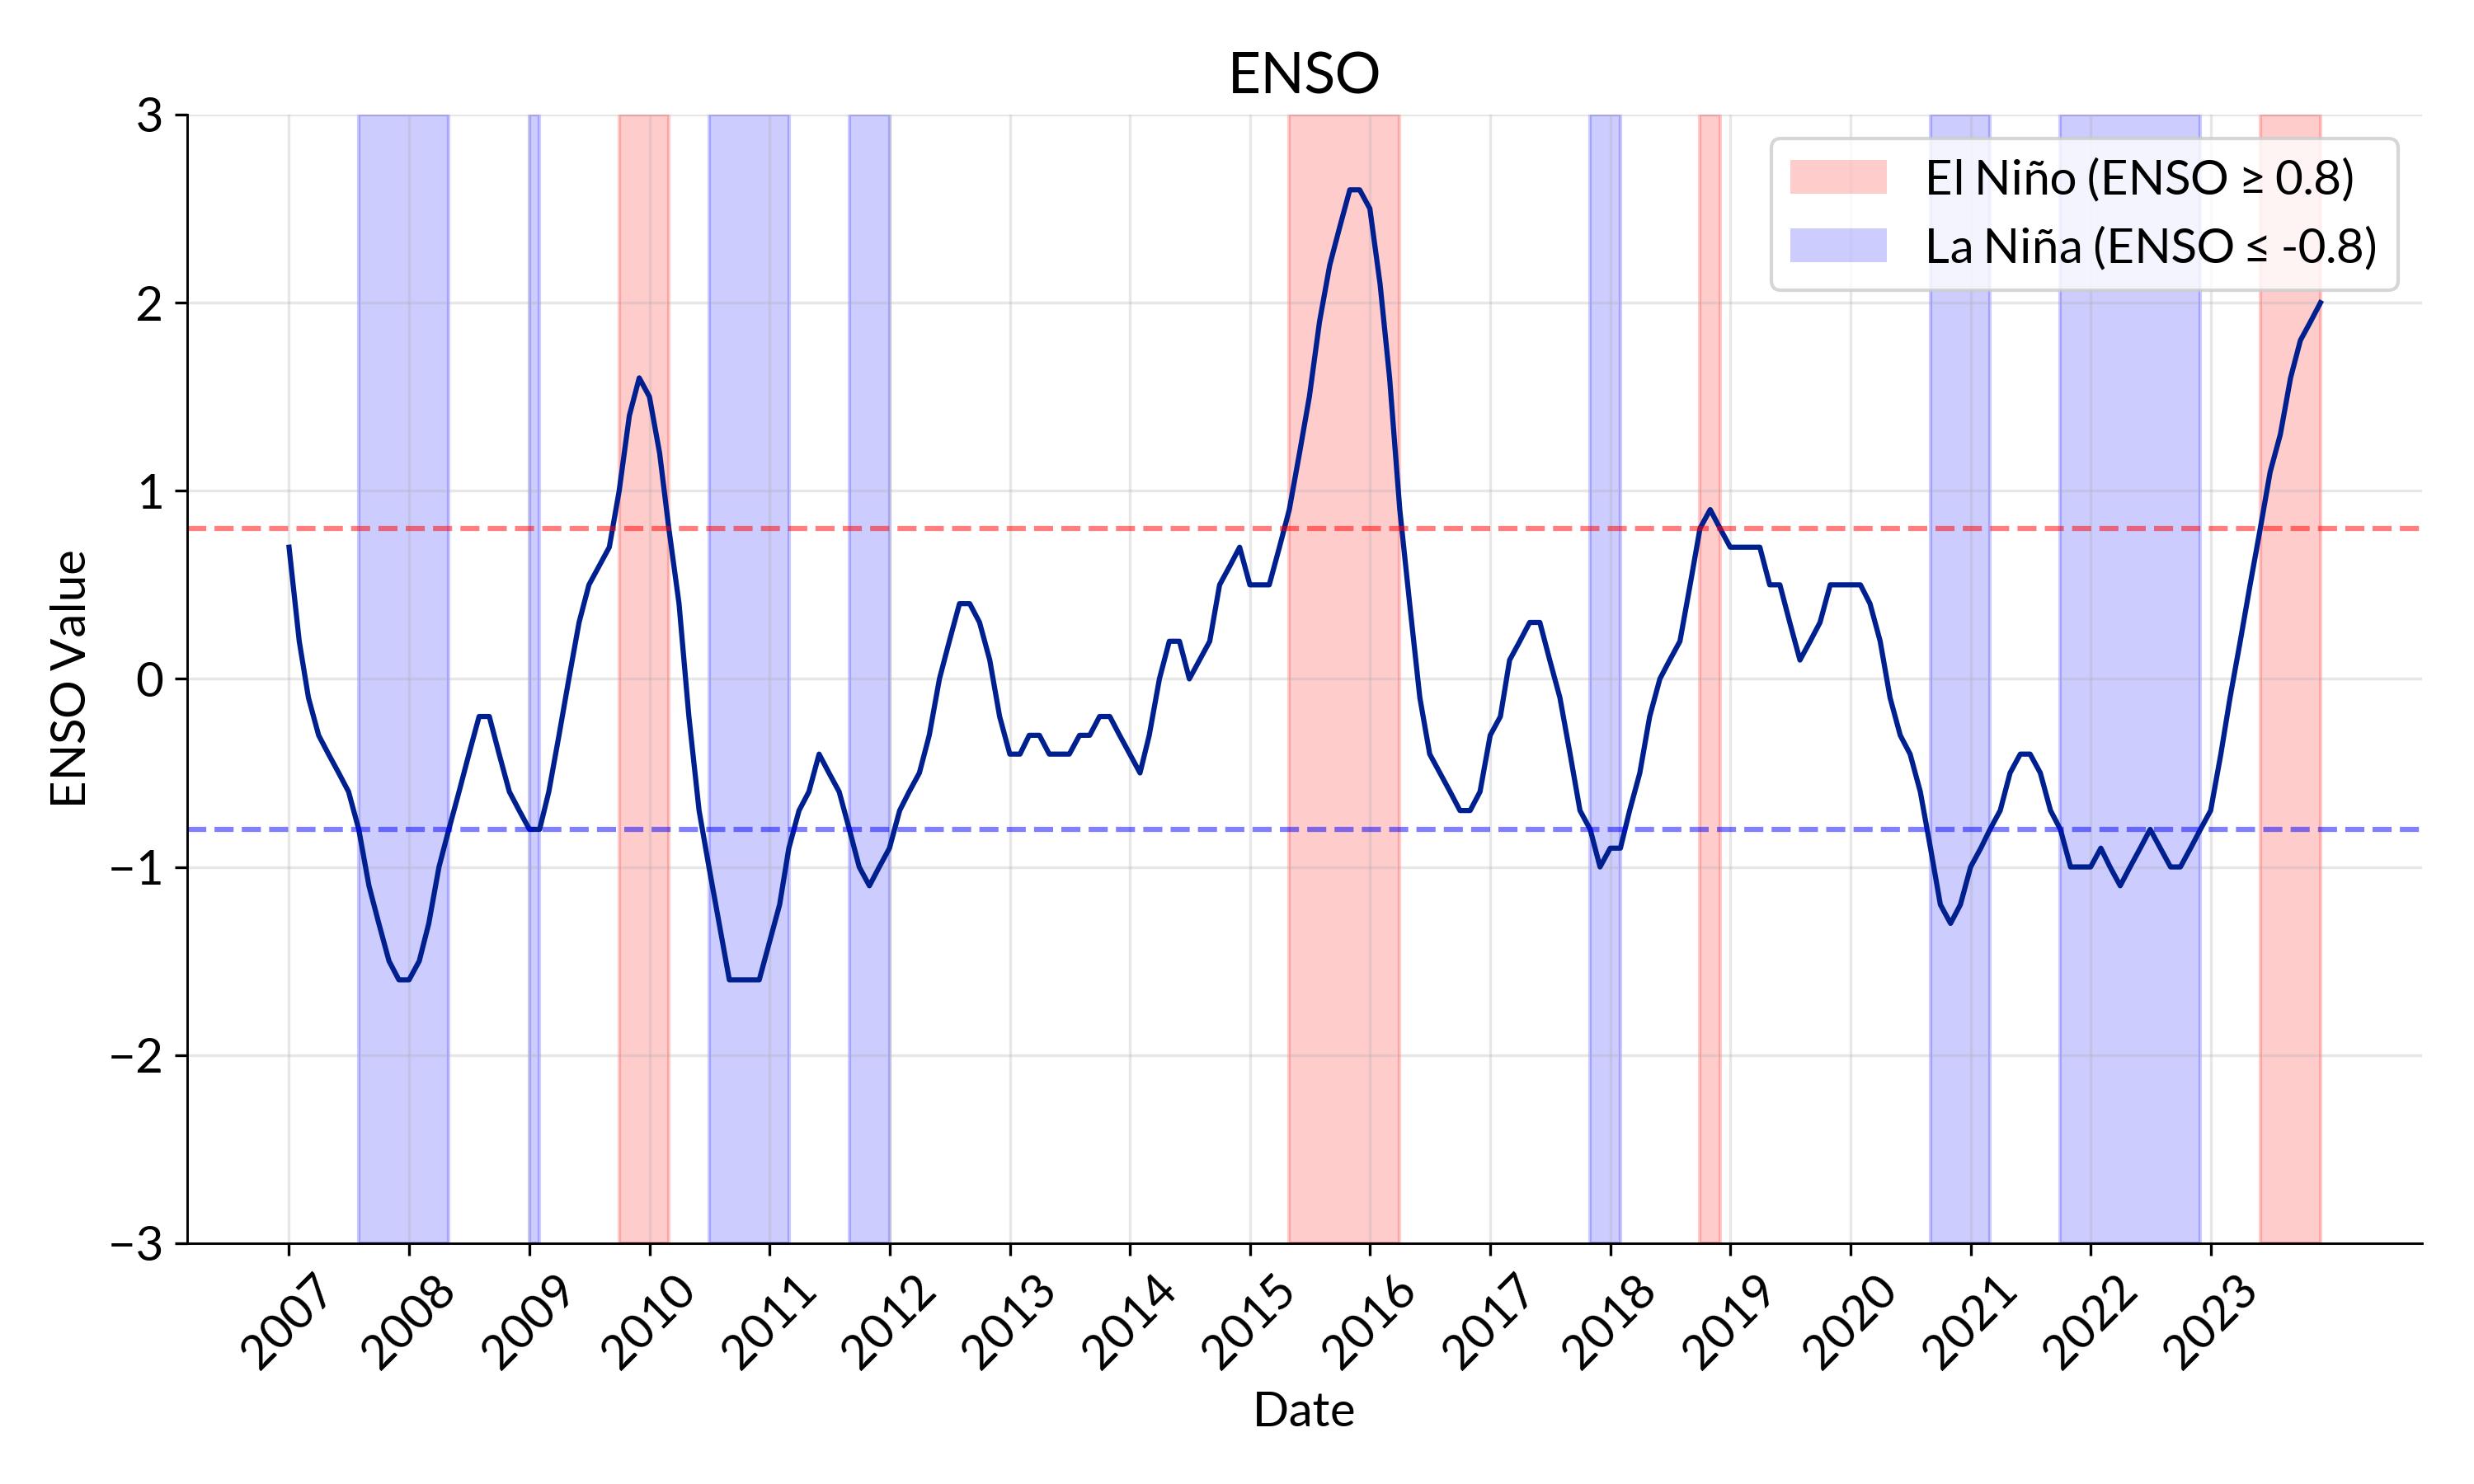
In Australia, the weather is affected by a number of climate influences. The one that is probably most known and talked about among glider pilots is the El Niño-Southern Oscillation (ENSO). Generally speaking, El Niño is associated lower rainfall in Australia and La Niña with higher rainfall. 
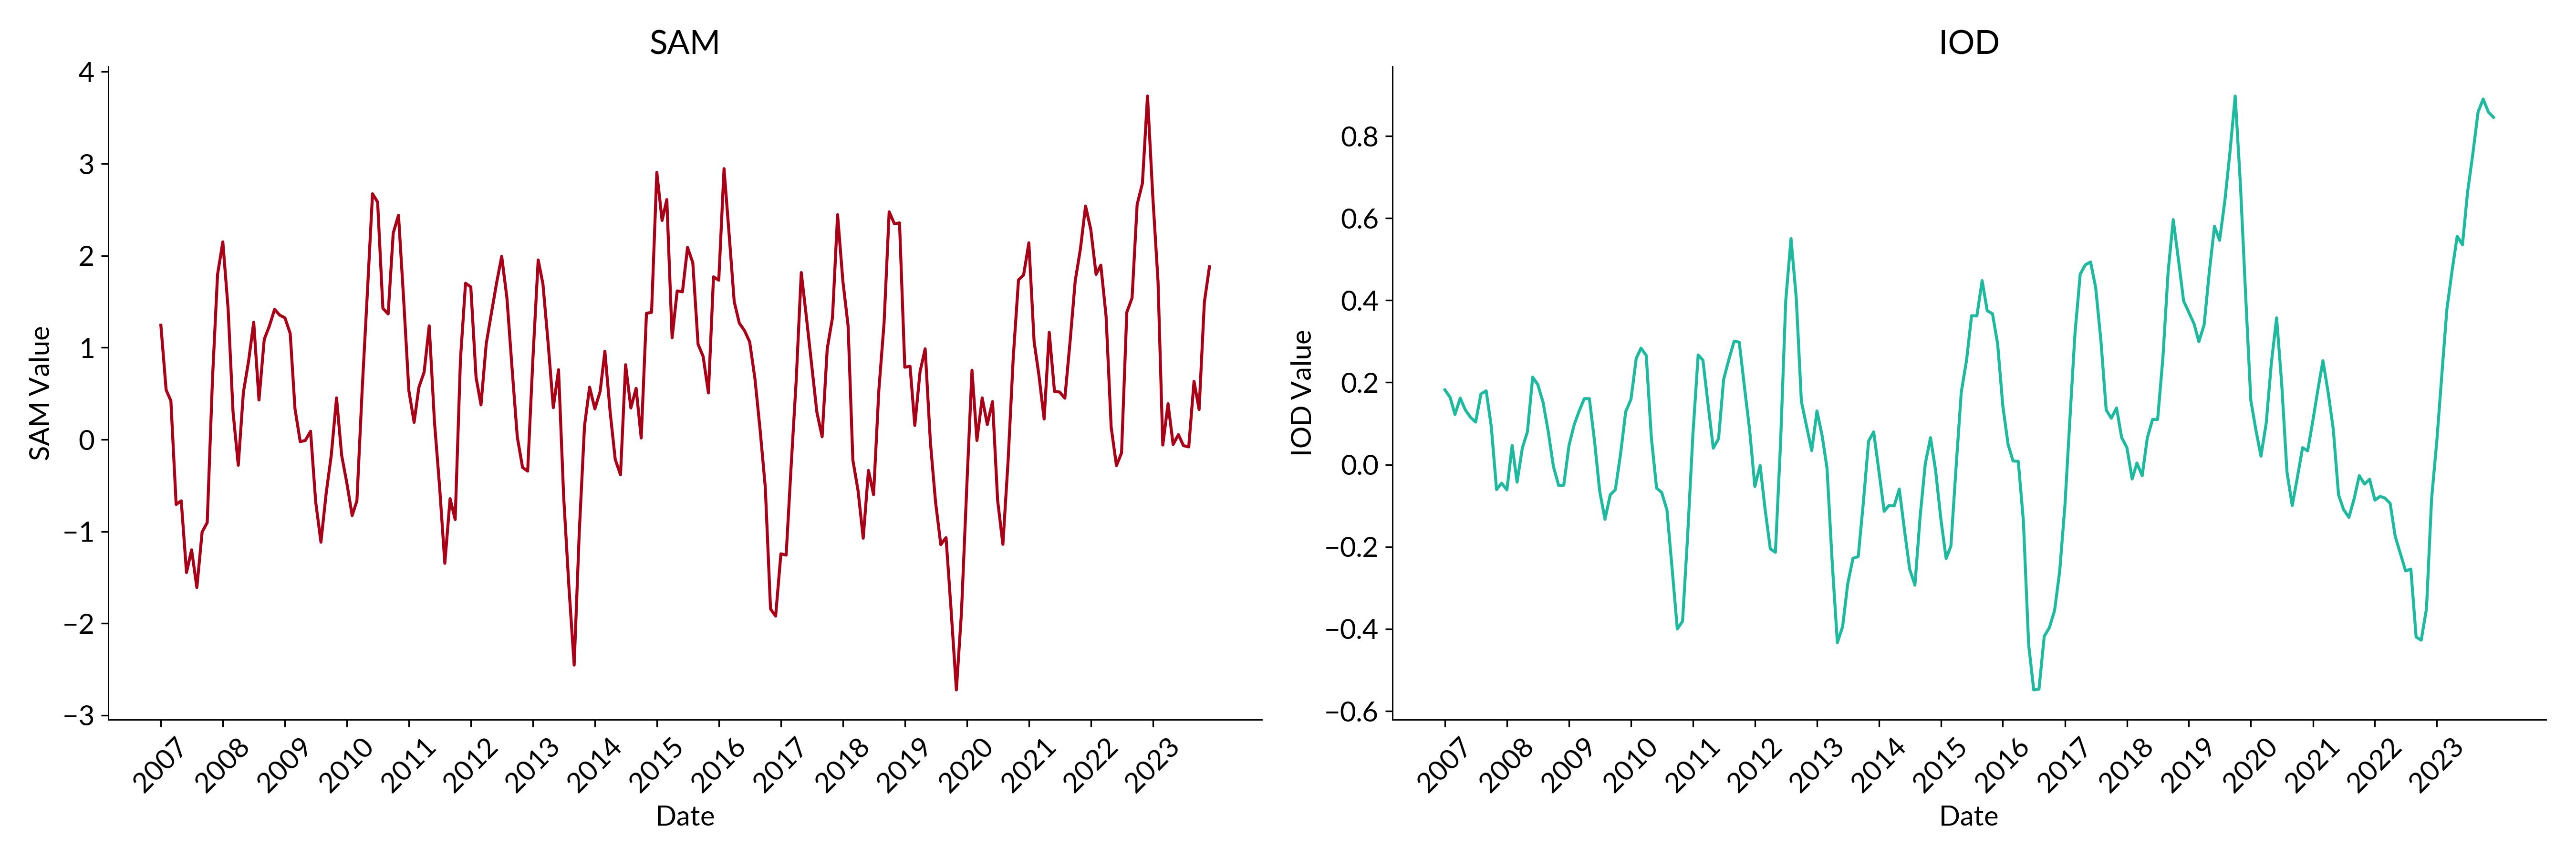
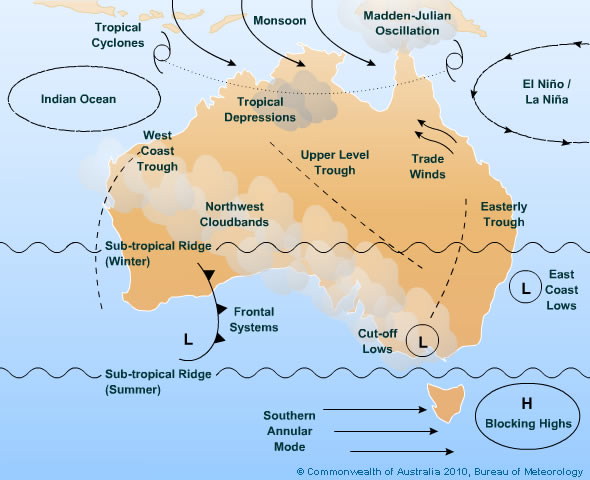
Other climate drivers that influence Australian weather are the Southern Annular Mode (SAM) and the Dipole Mode Index (DMI), which measures the Indian Ocean Dipole (IOD), and you can read more about them here and in the next section. Here's a nice map showing the main climate influences that affect the weather in Australia:

Weather Influences in Australia
Figure 1: Major climate influences affecting weather patterns across Australia.

But how do these influence gliding conditions? Does ENSO really have such a significant impact? And how is each of the states impacted by the different climate influences?

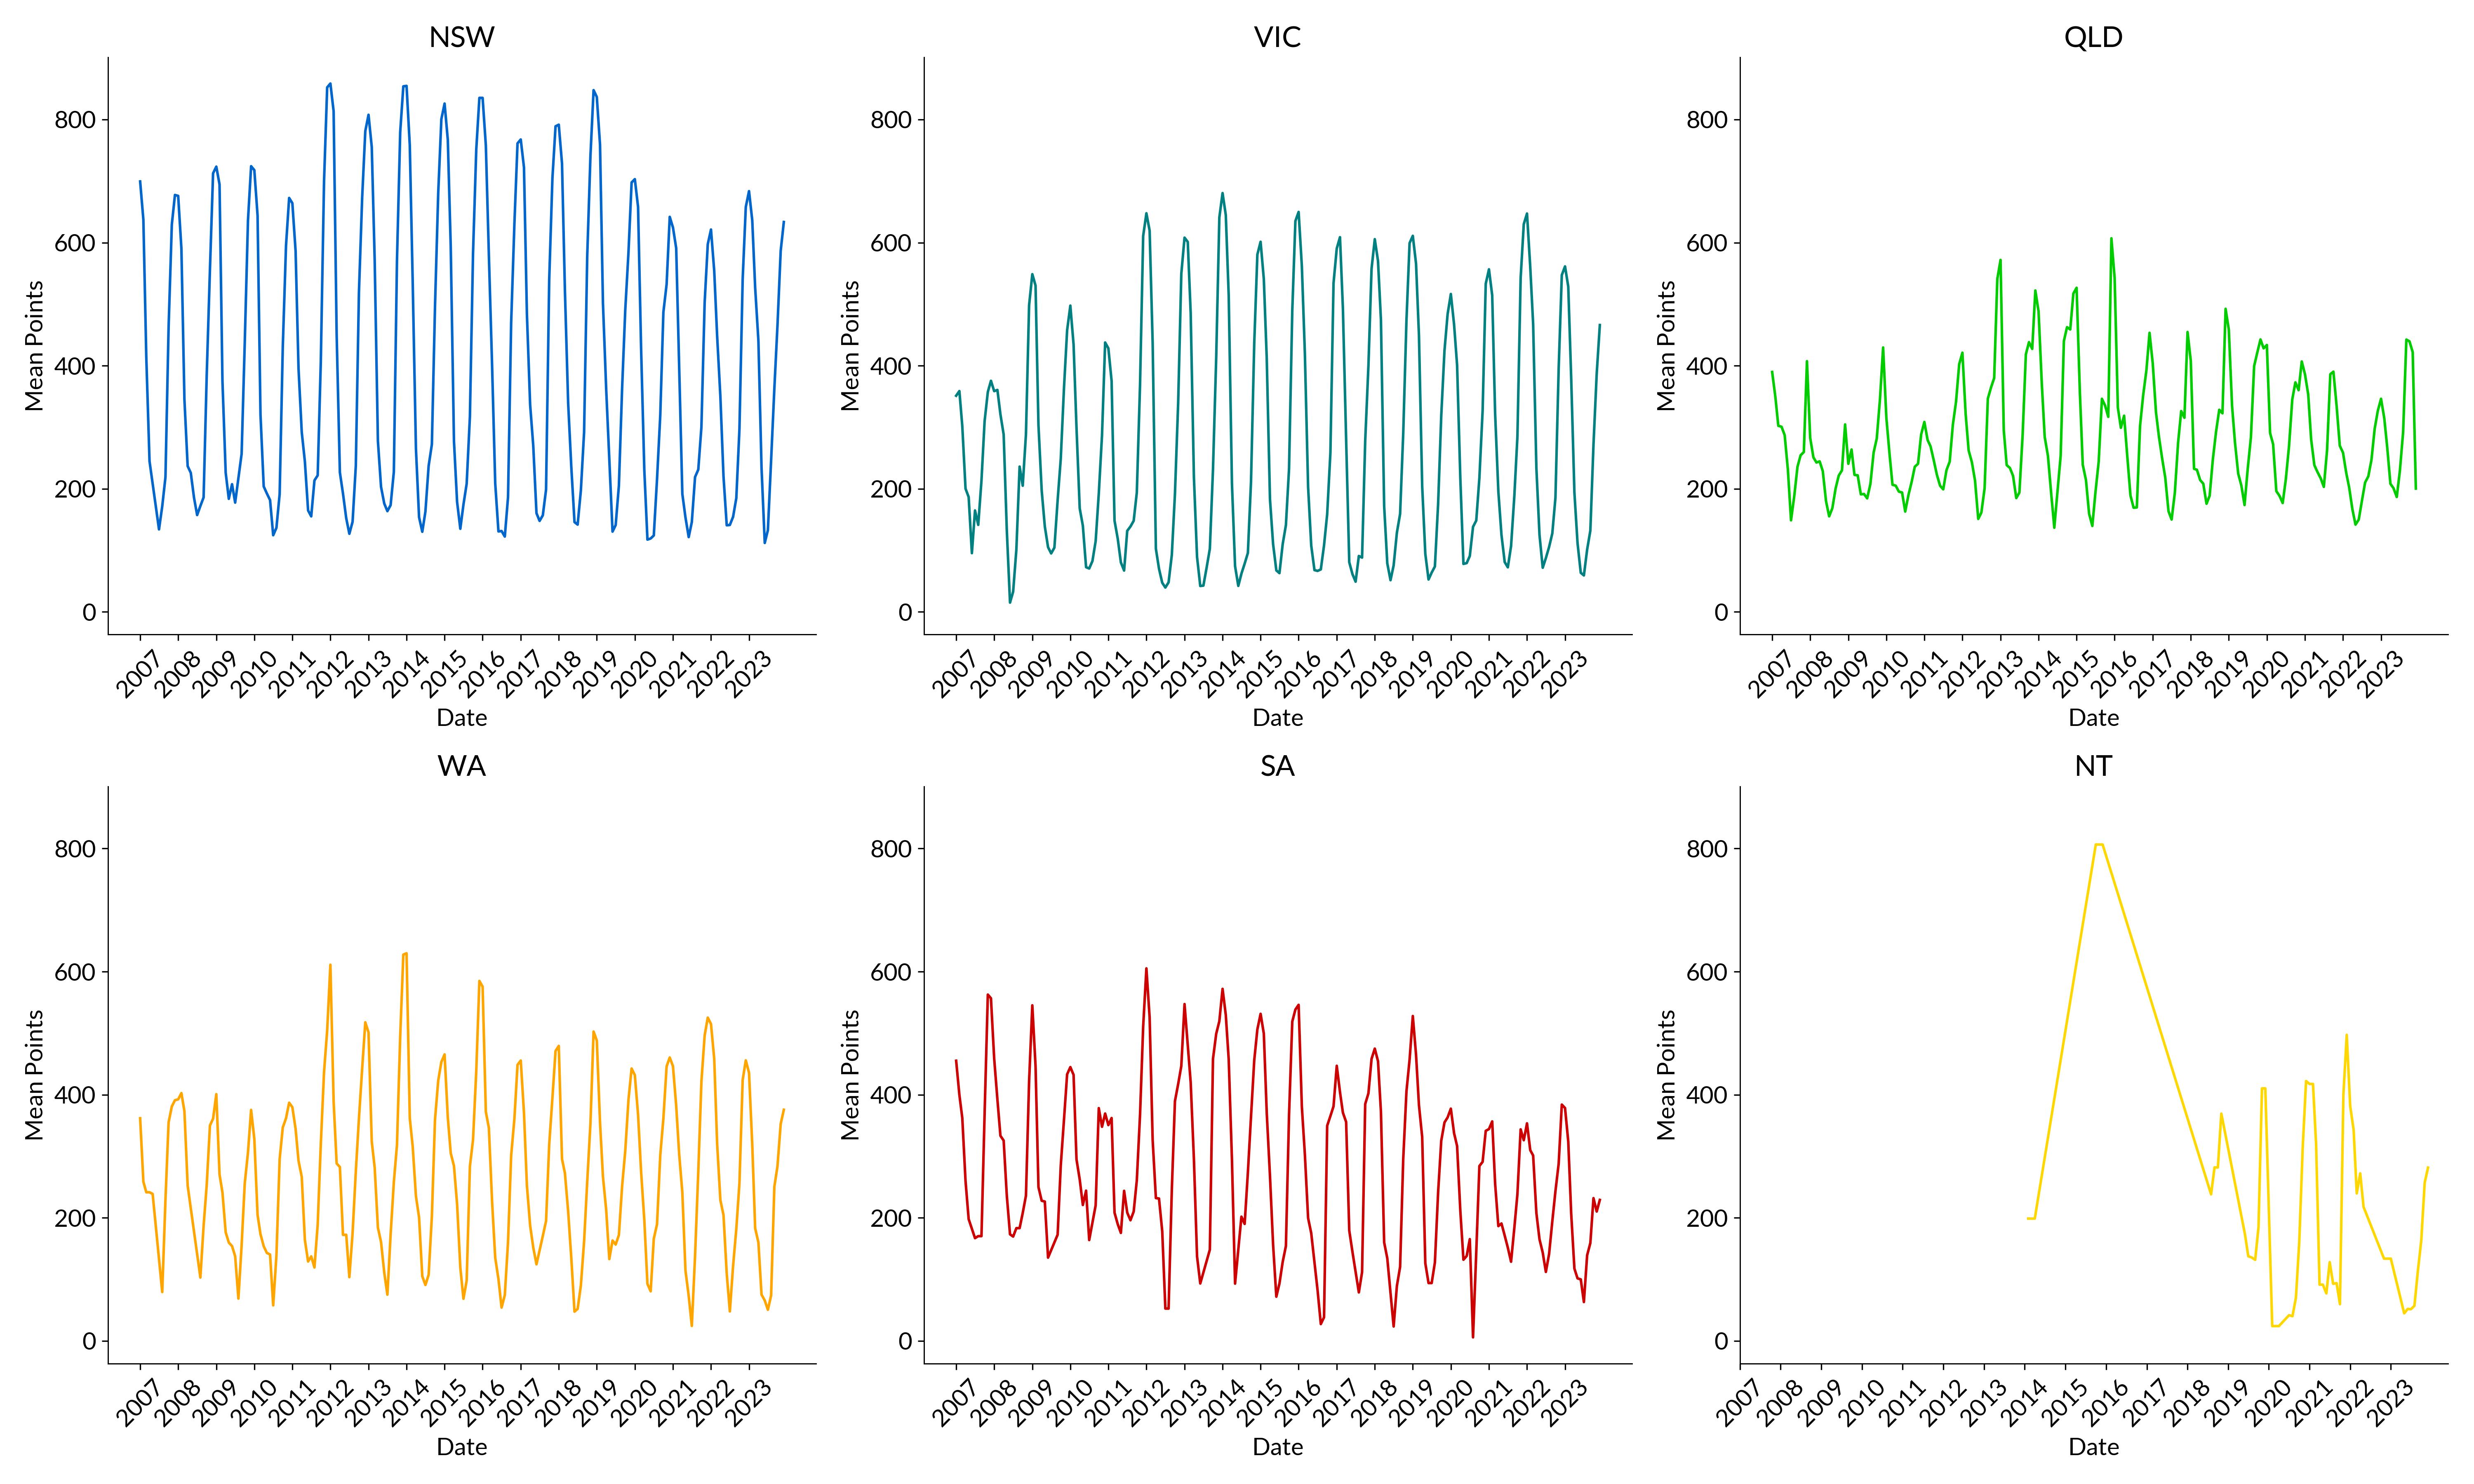
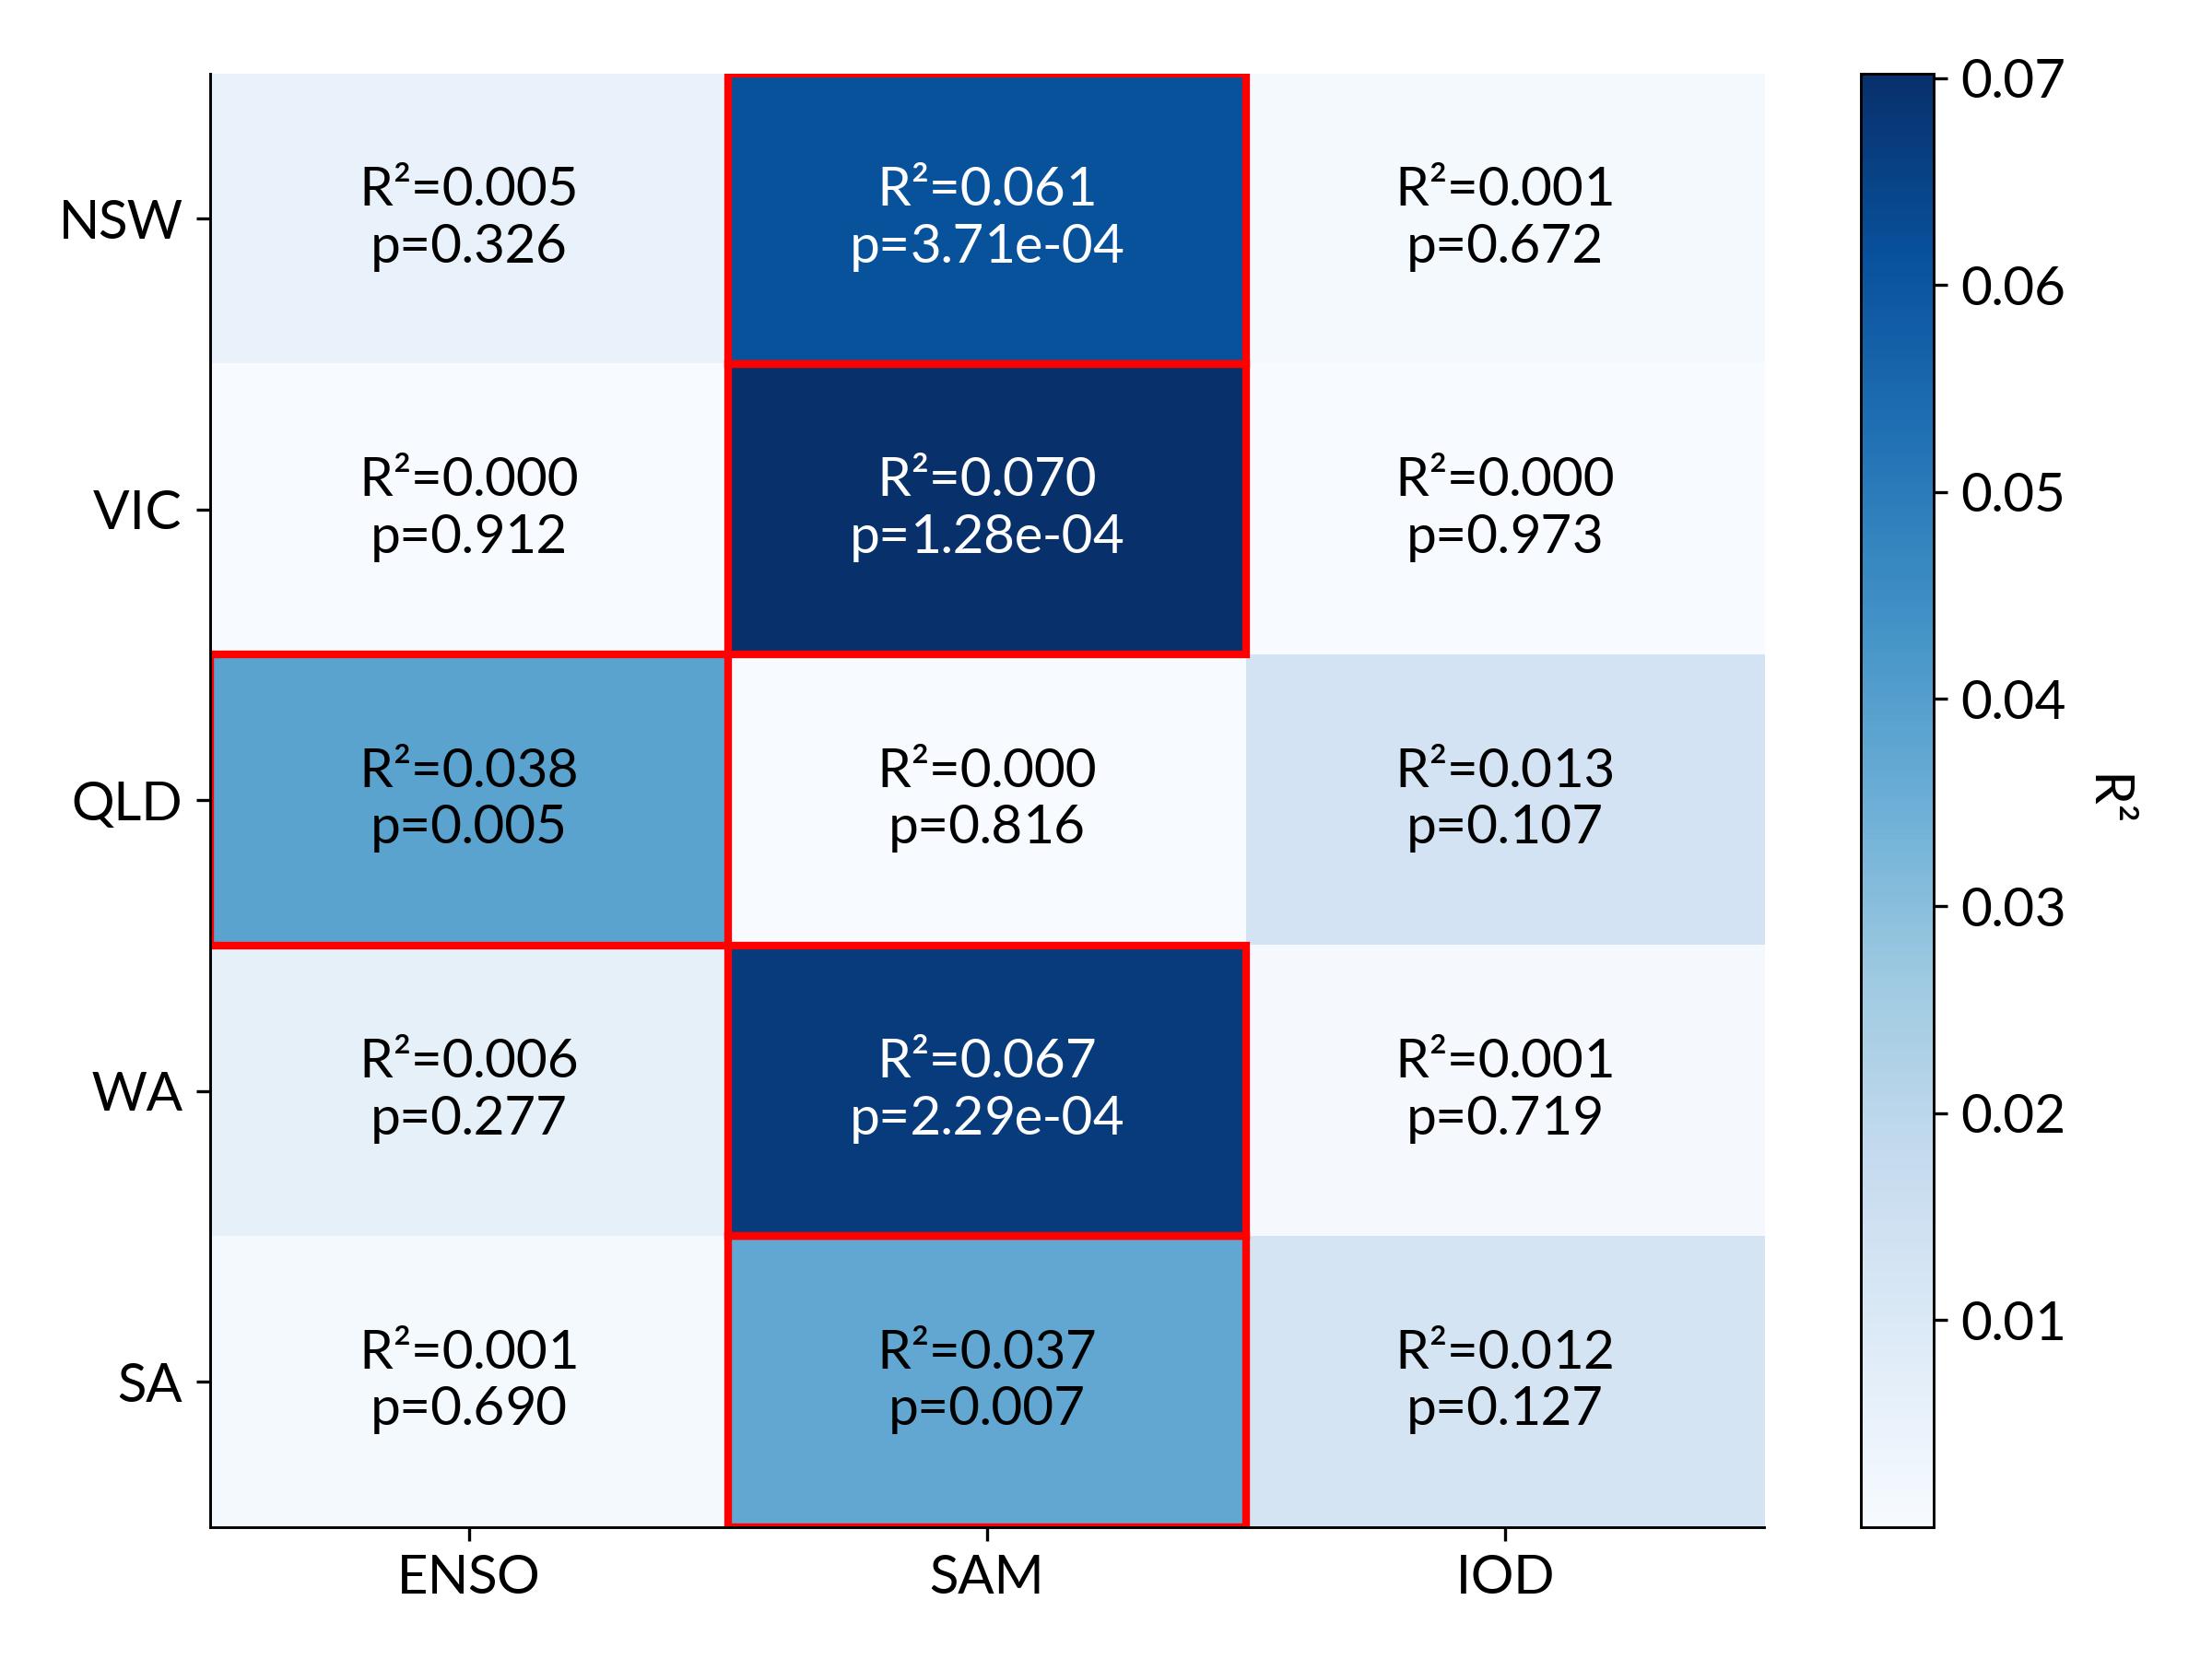
In this blog post, I will perform statistical analyses to investigate whether there is a significant relationship between three of the weather systems that affect Australia and the mean points of the top 250 flights over any three months period. Please note that there is not enough data to draw a definite conclusion! Additionally, there are some other weather systems that influence the weather across Australia.

Climate influences over time

First, we'll have a look at the pattern of the three climate influences over the last 16 years.

ENSO: El Niño/La Niña - A positive ENSO index (greater than +0.8, red) indicates El Niño conditions, while a negative index (less than -0.8, blue) indicates La Niña. El Niño is typically associated with below-average winter and spring rainfall along the East Coast and a drier onset to the wet season in northern Australia. La Niña usually brings increased rainfall to northern Australia and above-average rainfall to the East Coast and Central Australia. ENSO patterns often persist for several months.

Weather Influences in Australia
Figure 2: El Niño-Southern Oscillation (ENSO) over time.

SAM: The Southern Annular Mode (SAM), describes the north-south movement of the strong westerly winds that typically blow continously south of Australia. Positive and negative SAM phases generally last one to two weeks, creating much shorter intervals compared to ENSO. A negative SAM phase, in which the westerly winds shift northward, reduces the likelihood of rain in summer for eastern Australia. In contrast, a positive SAM phase, characterized by a southward shift of the westerly winds, increases the chances of summer rainfall.

IOD: The Indian Ocean Dipole (IOD) describes sustained changes in the sea surface temperature difference between the western and eastern Indian Ocean. A positive IOD (cooler-than-normal waters in the east and warmer-than-normal waters in the west) typically reduces rainfall across much of Australia. In contrast, a negative IOD, with warmer waters in the east and cooler waters in the west, increases rainfall chances across Australia due to enhanced convection over the eastern Indian Ocean.

Weather Influences in Australia
Figure 3: Southern Annular Mode (SAM) and Indian Ocean Dipole (IOD) over time.

Flight data over time

To assess how any of these climate influences impact gliding weather, we need to look at some flight data. There are two major platforms where people upload their flights - OLC and the newer WeGlide. If you're not a glider pilot, make sure to check out WeGlide and have a look at what amazing flights people do every day! I won't go into too much detail on how I downloaded the flight, made sure there were no duplicates and assigned each airfield to the right state (thanks AI!), but you can find the complete code on my GitHub.

Once I had all the data downloaded, I selected the average points of the top 250 flights in any 3-months period. The reason I decided to do this is because 1. this is how the ENSO value is calcuated (mean over 3 months) and 2. we want to look at how the weather influences impact longer time periods and not just weeks that might be outliers.

Let's have a look at the mean points over the years for each of the states we have data for. Firstly, we notice that there is a lot of fluctuation in the data. This is to be expected because gliding conditions tend to be much better in summer than in winter! Secondly, we can see that the data for the NT is quite messy. This is because people don't fly there very often. We will exclude the NT from our analysis.

Mean Points over the years

Figure 4: Mean points over time, split by state. NSW = New South Wales, VIC = Victoria, QLD = Queensland, WA = Western Australia, SA = South Australia, NT = Norther Territory

Correlations between weather influences and achieved points

Before we do the statistical analysis, let's look at simple correlation plots. In this heatmap, we can see the R2 value (how much of the variation in the data is explained by this parameter) and the p-value (how significant is this relationship). The significant relationships are highlighted in red.

Correlation heatmap
Figure 5: Correlation heatmap showing each state and each weather parameter. NSW = New South Wales, VIC = Victoria, QLD = Queensland, WA = Western Australia, SA = South Australia, NT = Norther Territory, ENSO = El Niño-Southern Oscillation, SAM = Southern Annular Mode, IOD = Indian Ocean Dipole.

We can see that even when the relationship is statistically significant, the R2 value is quite low. This means that only a small percentage of the variation in the data is explained by this specific parameter. In other words: gliding weather is strongly influenced by something other than a single weather influence.

We will need to perform some slightly more complex statistical analysis that takes into account multiple parameters - Multiple Linear Regression.

Multiple Linear Regression Analysis

To understand whether any of the relationships are statistically significant, we perform Multiple Linear Regression with "Mean Points" as the dependent variable and the climate influences (ENSO, SAM and IOD) as the independent variables. We know that there is one parameter that significantly influences the gliding weather, and that's the time of the year. This is why we add the month as another variable and make sure the relationship is continuous (i.e. the model knows that January comes after December). As expected, the month impacts the weather significantly, but because we are interested in the weather influences, the month has been excluded from the summary tables.

First, let's look at the p-values. A p-value < 0.05 (highlighted in green) indicates that there is a significant relationship (= the lower the p-value, the more significant).

Results of Regression Model (p-values)
StateENSOSAMIODENSO+SAMENSO+IODSAM+IODENSO+SAM+IOD
NSW0.00230.03340.74870.06020.26370.25750.0095
VIC0.39350.13660.76370.04930.22350.26630.3897
QLD0.00200.66530.95210.03510.77820.76580.0001
WA0.11890.05110.92060.01410.73600.46770.3292
SA0.22090.52010.15450.52050.05110.31630.3031

We can see that ENSO significantly impacts the mean points in NSW and QLD. Additionally, SAM has a significant impact in NSW. Interestingly, when doing the interaction analysis (checking whether there is a joint effect), we can see that ENSO+SAM influence the mean points in WA, Victoria and QLD and all three climate influences together impact the gliding conditions in NSW and QLD. We will get back to that, but first we want to look how good our model actually is.

To evaluate the regression model, we look at the R2. The R2 value measures how much variance in the dependent variable is explained by the independent variables. In this case, the R2 is above 0.5 for all states, which means that more than 50% of the variation in the mean points is explained by the month, ENSO, SAM or IOD values. The model explains the variance of mean points pretty well in WA, VIC and NSW, but there seem to be other things at play in both SA and QLD.

R-squared values for weather models in different states
StateR-squared
NSW0.9193
VIC0.8710
QLD0.6810
WA0.8389
SA0.7624

Weather Prediction Tool

With the help of our regression models that are performing well (high R2 values), we can predict the mean points for any combination of ENSO, SAM and IOD for any month of the year and any of the 5 states included in this analysis. You can find a summary of the current ENSO, SAM and IOD indices on the BOM website. Now plug in the data and see how many points you should aim for! It's important to remember that all variables affect gliding conditions to some extent, but only the interactions in the previous section are statistically meaningful. Note that this is just a model! I built this prediction tool because I thought it would be fun to play around with the parameters to see how they are predicted to influence the conditions.

0.0
0.0
0.0

Predictions

State
Points
Deviation
Points = predicted mean points over top 250 flights, Deviation = deviation from mean for that region and month

Summary

Here, we summarize the findings in a very simplified way. Please remember that while technically statistically significant, some of the relationships are not very strong. We would need more data to draw definite conclusions, so ask me again in about 30 years.

State
QLDHigh ENSO (El Niño) = good conditions. Additionally influenced by SAM.
NSWHigh ENSO (El Niño) OR high SAM = good conditions.
VICGood conditions when both ENSO and SAM are high.
WAGood conditions when both ENSO and SAM are high.
SANo signficant impact.

Of course this is simplified. If you are interested in understanding the three-way effect, go check out the GitHub notebook where I analyzed the interactions in a bit more detail. Some interesting observations include that generally, when IOD is high and SAM is high, a higher ENSO leads to worse conditions!

Conclusion

While La Niña and El Niño significantly influence the gliding conditions in Queensland and NSW, it's a bit more complex in the other states. WA and Victoria are influenced by ENSO and SAM together, which means that a positive ENSO only has a significant impact on gliding conditions when SAM is also positive (or vice versa). SA seems to be influenced by something that is not part of this model, so some further investigation is needed!

Powered by SkySight